“Tell me how fast you go and I’ll tell you who you are” - Ivan D Illich.
The current distribution of transportation resources contributes to a systemic socioeconomic issue that can be solved through reforming our network. This inequality stems beyond transport; change is nessesary in order to meet equity goals, which are as much about access as it is about inclusiveness.
Public Transport is a fundamental civil right and should be treated as a public service. However, Transport historically within Melbourne favors wealthier communities, while those who purchased cheaper homes further from the CBD are given a ‘Transport Tax’.
The SEIFA (Socio-Economic Indexes for Areas) decile is an excellent area-based metric for measuring relative socio-economic advantage and disadvantage across Australian communities. By overlaying SEIFA data on top of the high-quality network and including a dot density of dwellings, we can see the communities most in need of transport.
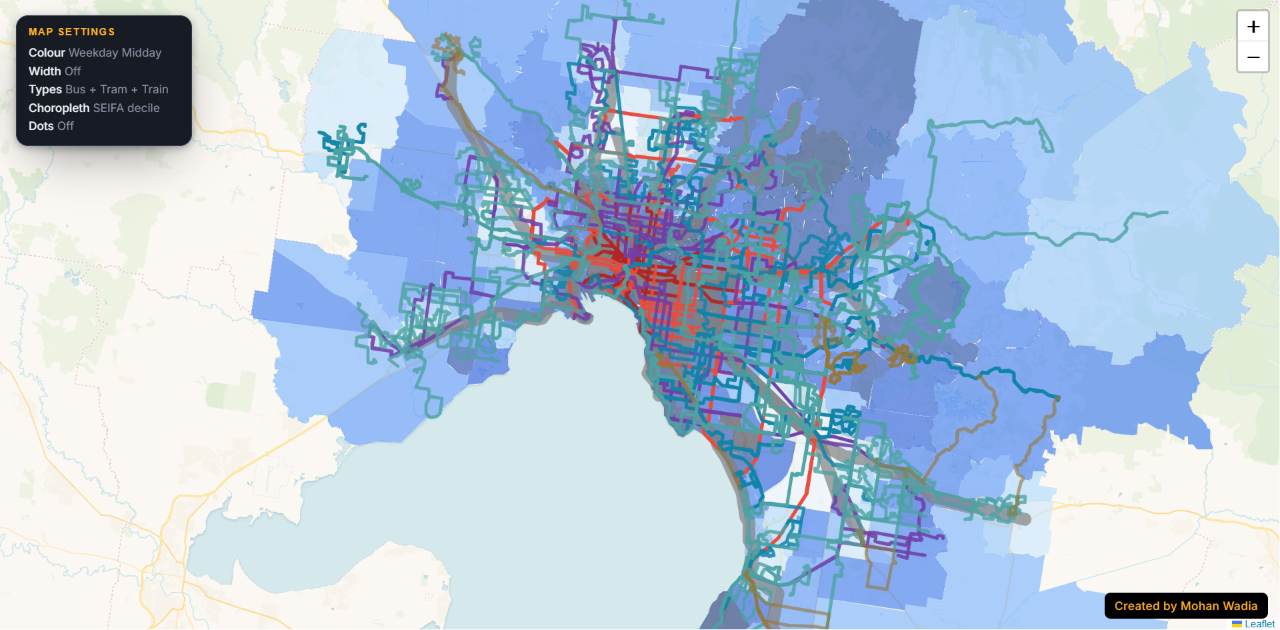
To better quantify this data, I calculated a Transport Disadvantage Index by taking the product of a SA2’s normalized SEIFA score and the percentage of dwellings with high-quality public transport:
| Rank | SA2 | SEIFA Decile | % dwellings with 800m of a high quality public transport service | Disadvantage Index |
|---|---|---|---|---|
| 1 | Melton | 1.0 | 0.0% | 0.978261 |
| 2 | Kings Park | 1.0 | 6.1% | 0.886543 |
| 3 | Melton South – Weir Views | 1.0 | 0.0% | 0.860248 |
| 4 | St Albans – North | 1.0 | 14.7% | 0.781250 |
| 5 | Lalor – East | 2.0 | 5.6% | 0.767775 |
| 6 | Noble Park – West | 1.0 | 8.7% | 0.765810 |
| 7 | Melton West | 2.0 | 0.0% | 0.739130 |
| 8 | Kurunjang – Toolern Vale | 2.0 | 0.0% | 0.736025 |
| 9 | Hampton Park – West | 2.0 | 9.5% | 0.730437 |
| 10 | Pakenham – South East | 2.0 | 1.2% | 0.717932 |
A significant portion of these areas are outer-suburban growth corridors with rapidly growing housing developments. St Albans-North, Kings Park Lalor East, and Noble Park West are more established middle-to-outer suburbs that have a perception of transport however routes run at low frequencies making them functionally unusable. Combining poor public transit with an extremely low SEIFA score means that residents are paying the highest Transport Tax in Melbourne.
Looking at places with the greatest difference between % with PT and % with high-quality PT, we get the ‘Map of Transport Illusion’. The following map shows a dot density of dwellings served by high-quality (green), low-quality (yellow), and no (red) public transit services at a scale of 1:500. This is overlayed with a choropleth of residents with only access to infrequent public transport, where red indicated regions of high access to low frequency options but low access to the useable network. Therefore, we can see where continued investments in services should be allocated to reach the most amount of people.
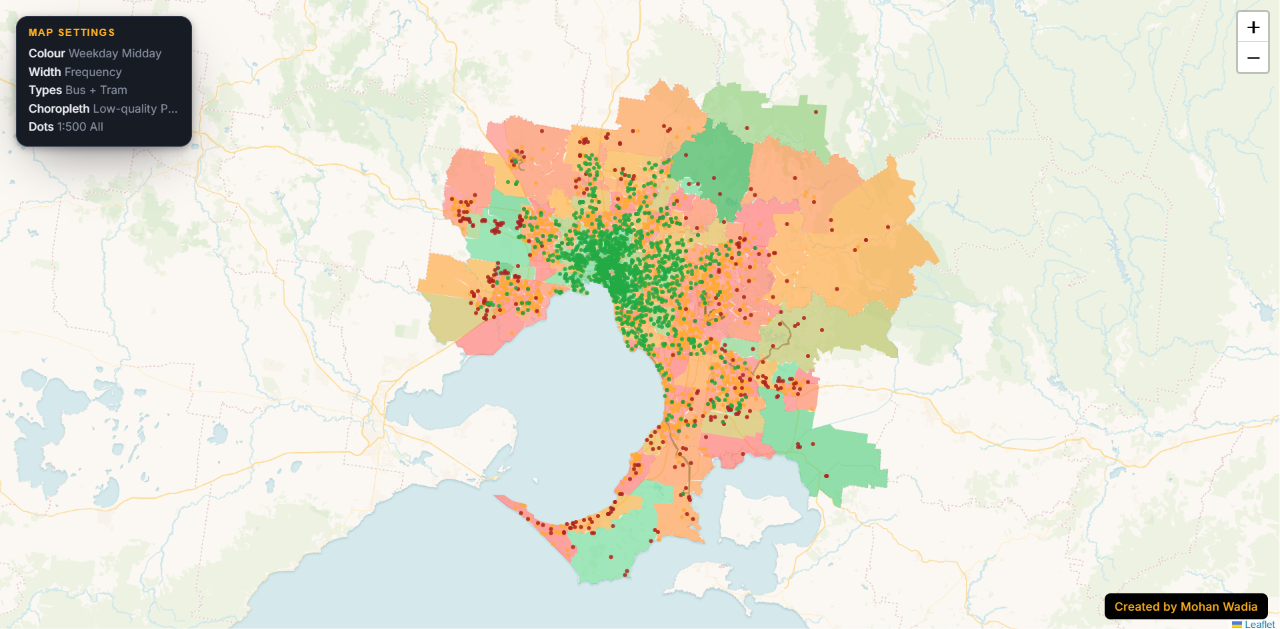
According to 2021-22 ABS Data, among those who do not use public transport after dark, women are six times more likely than men to avoid it specifically because they feel unsafe. Service gaps and extended wait times effect the perceived safety of a network, shifting the ‘personal burden’ of safety onto vulnerable group and forcing them into hypervigilant coping behaviours or total avoidance. The excerpt below is from a Melbourne study by Sarker et al. (2026).
Harassment of women on transit is widely recognized as a major factor influencing personal safety perceptions and places a ‘personal burden’ on women… One of the strategies of safety work is to adopt precautionary measures…also referred to as coping mechanisms, include planning strategies, surveillance, becoming invisible and relying on technology for separation and communications.
Poor wait times for public transportation at perceived unsafe locations disproportionally impacts women and other vulnerable groups. It should be noted that distance isn’t the only metric of walkability; active transport infrastructure, pedestrian crossings, and street lights also contribute to the illusion of access. Moreover, I believe VAGO’s classification of a high-quality public transport service is limited because of its absence of a frequency restriction after 8pm on weekdays and a lack of consideration for weekend frequency at all.
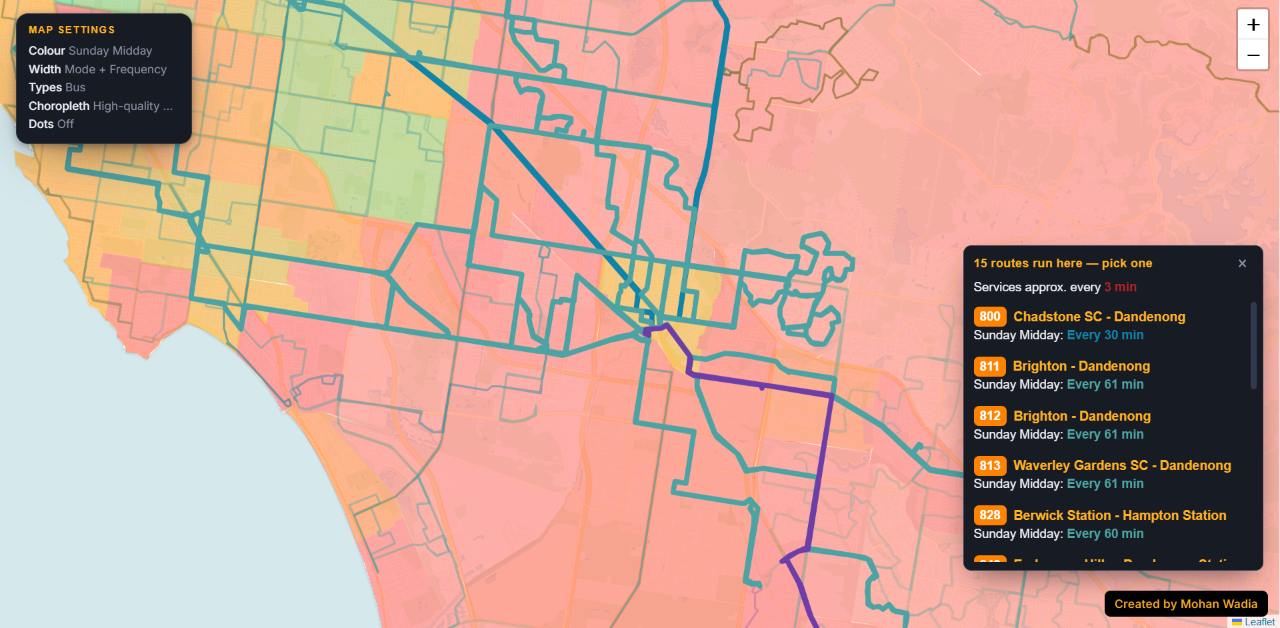
There are multiple places on our network where there are a many of buses, yet no one corridor has a frequent service. Going to the Dandenong Station Bus Interchange on a Sunday, you can get on a bus on average within 3 minutes.. but only if you don’t care in which direction you’re travelling.
For public transport to be useable to young people, it cannot simply focus on the needs of 9-5 commuters. Forming a new generation of willing transport users is crucial for forming positive sustainable habits, forming a major incentive to recently provide free travel for under-18s. However according to a Melbourne study by Jafari et al. (2026) attitudes vary between teenagers focusing on navigation concerns, while parents focus on safety concerns. Both of these real issues can be mitigated by transit agencies through thought-out integrated systems.
By considering the perspectives of both parents and adolescents, and building on the strategies they already use to navigate transit challenges, policymakers can take further steps to design a public transport system that is more adolescent-friendly.
Providing access for disabled and aging riders is also important. Most buses are low-floor with ramps and wheelchair spaces, and all train stations except Heyington do support wheelchair, strollers, and mobility aids. Hailo Solutions is doing a superb job in Melbourne in making catching transport accessible and stress-free by allowing users to digitally hail supported buses.
However in 2023-24, only 18% of tram services were accessible. When relying on a legacy network that runs high-floor trams on stops that do not provide level-access, both need to be upgraded through an accelerated rollout to meet the Disability Standards for Accessible Public Transport guidelines. Universal design benefits all riders, where platform stops separate passengers from traffic, and wheelchair spaces and level boarding providing space for prams, and support travellers with luggage, injured, elderly, etc.
Forcing vulnerable riders onto more expensive modes such as rideshare is not inclusive, and erases the benefits of subsidising public transit fares. Affordability concerns were partially alleviated in 2026, with Cost of Living Relief through free and cheaper fares. Further subsidised concession fares are economic lifelines for attracting users that could otherwise not afford it. Flat-rate fares will always hit low-income riders much harder as a proportion of their income, however with low-income suburbs stretching away from the CBD, it also takes lower earners longer to take these journeys. The choropleth below maps household income (darker is greater).
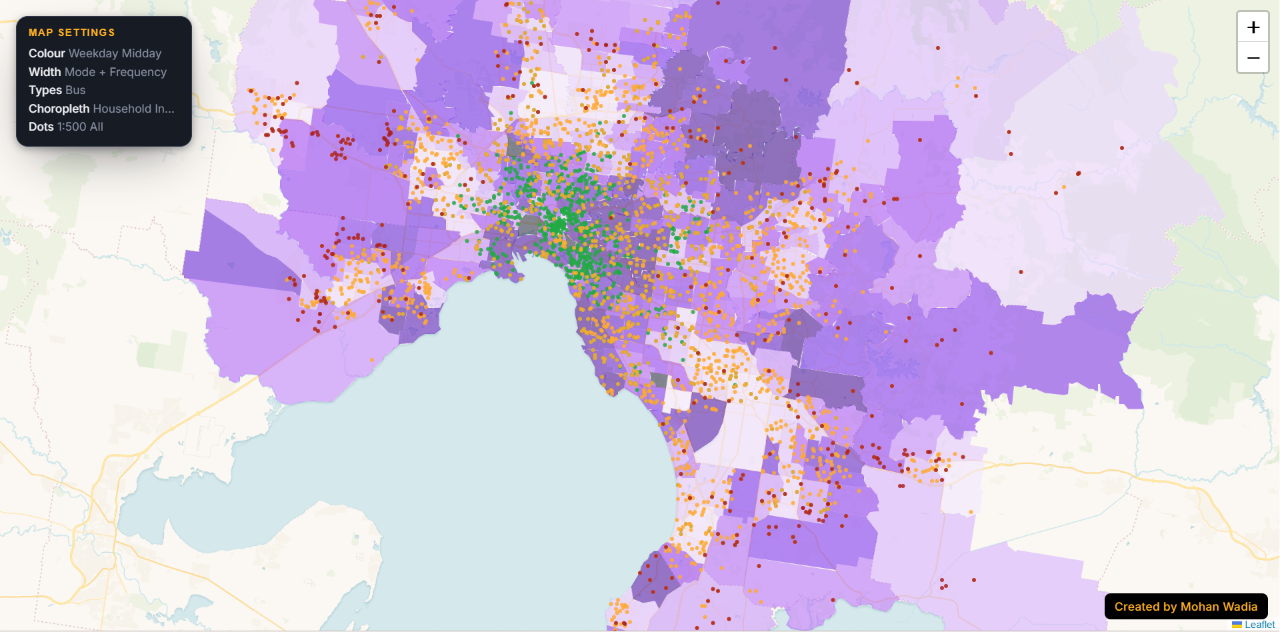
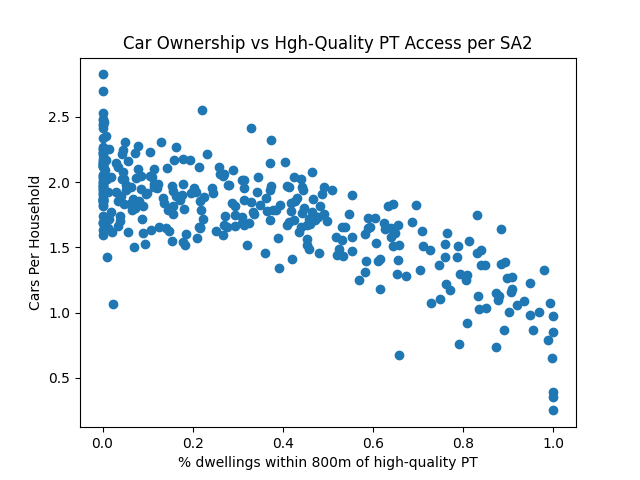
When cities invest heavily in dense, frequent, and reliable transit corridors, the financial and logistical burdens of maintaining multiple cars reduces, and shifts away as a necessity for basic mobility. Comparing household car ownerships against the accessibility of both high-quality and any PT, there’s a much stronger relationship with high-quality transit at a R² value of 0.577 compared to 0.248. Low quality bus services are ignored by most, while high-quality transit corridors form positive household habits.
Increasing the usage of public transport comes down to expanding it’s usefulness beyond a commuter based service. A recent Sydney study by Jennifer Kent insightfully illuminates the cultural expectations of parents requiring cars, referencing an excerpt from Kent and Mulley (2022):
This restrictive policy stance reflects the city’s approach to public transport provision that, through both its network structure and mode of operation, prioritises predictable “clean” trips, primarily the journey to work, over the less predictable “messy” trips that are more likely to make up modern life.
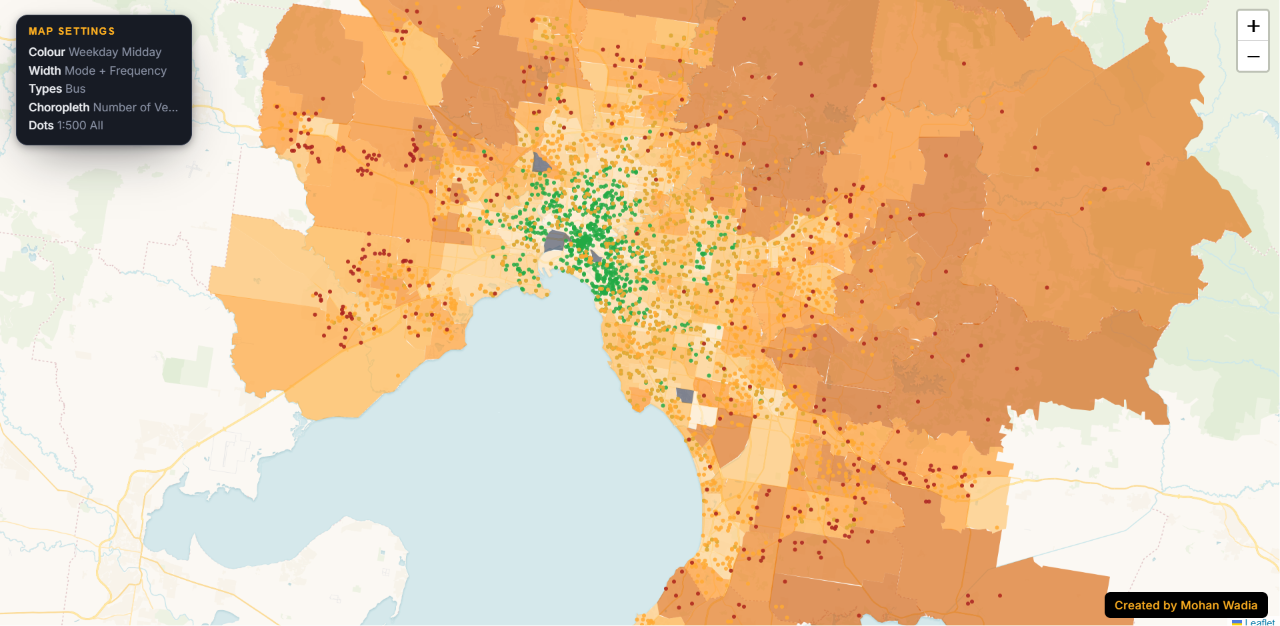
However most outer-suburban families which tend to be lower income aren’t given a choice and are forced to buy and maintain cars they cannot comfortably afford, trapping them in transport poverty. Below maps number of cars (lighter is less) against dot density.
Public transport is the backbone of social mobility, yet Melbourne’s current system acts as a barrier rather than an enabler, particularly towards vulnerable groups. While recent network investments are a step in the right direction, small changes can not achieve the deep reform needed to build a system where every resident, regardless of their background, has the freedom to move.