Victoria’s road network has historically and continues to be built for maximizing capacity. Widen urban arterials divide neighbourhoods and an expansive network of roads stretch into regional suburbs. Just to maintain our road network, the price tag sits at $714 per resident per year.
There is a need to find and update dangerous intersections. Since adopting the Safe System approach, attention has been placed on improving the safety of our existing roads. However, we still have a long way to go to Vision Zero by 2050. There were 1314 fatalities on our roads in 2025, and the annual economic cost of crashes in Australia is $27.6 billion per year.
Previous reports such as RACV’s annual survey and AAMI’s recently published top 10 intersections look at data to find dangerous intersections, however I wanted to look at the relationship between crash volume and traffic volume. Additionally, RACV chooses not to use crash data to influence their ranking, while AAMI uses their own motor insurance claims database creating irreplicable analysis. Meanwhile, Transport Victoria does not publish any intersection rankings.
What makes an intersection dangerous?
To calculate the true impact of each signalized Melbourne intersection over the past ten years, I started with a simpler approach ranking intersections by the number of accidents. However this ranking ignored crash severity and traffic volume, visible as these intersections all have the most recorded crashes at 56 each with no casualties and #2 and #3 experience extremely high traffic.
| Intersection | Volume (Percentile) | ++Crashes (#)++ |
|---|---|---|
| #1 CEMETERY / LYGON / PRINCES | 75th | 56 |
| #2 SYDNEY / MAHONEYS / CAMP | 97th | 56 |
| #3 CLYDE / GREAVES / O’SHEA | 98th | 56 |
Similarly, ranking by number of serious accidents retains this bias. We can find the most deadly intersections, but these aren’t necessarily the most dangerous. #2 and #3 have a relatively low number of crashes.
| Intersection | Crashes (#) | ++Fatalities (#)++ |
|---|---|---|
| #1 FLEMINGTON / GATEHOUSE / HARKER | 35 | 3 |
| #2 WELLINGTON / SILKWOOD / BRAEBURN | 5 | 2 |
| #3 WESTALL / ROSEBANK | 5 | 2 |
Using a crash index metric does emphasize severity, for example the Bureau of Infrastructure and Transport Research Economics (BITRE) report titled ‘Evaluation of the Black Spot Program’ weights fatalities and serious injuries at 9.5, minor injuries at 3.5, and property damage only at 1. (Page 59) However it only counts the most severe casualty in the crash, and provides subjective weightings which are dimensionless. Each of these intersections below have 50+ crashes with no fatalities:
| Intersection | Volume (Percentile) | ++Weighted Score++ |
|---|---|---|
| #1 CLYDE / GREAVES / O’SHEA | 96th | 111.0 |
| #2 PHE / WARRIGAL | 98th | 110.0 |
| #3 SYDNEY RD / SOMERTON / COOPER | 96th | 106.0 |
A cost-based approach was chosen as expressing crash severity in a monetary value is objective. Additionally, it allows for benefit-cost ratios (BCR) to be calculated, which are important tools in advocating for, as BCR hurdles often implement a baseline filter of 1.0 to not be rejected, and greater than 1.0 when funds are relatively scarce. For example, the Australian Black Spot Program requires a BCR of 2+ as well as 2-3 casualty crushes and an average of 0.13-0.2 casualty crushes per km over a 5-year span.
Putting a price on a crash
It’s uncomfortable to ask what the cost of accidents truly is. There will never be standards for evaluating the value of a human life. However it’s also unfeasible to spend an infinite amount of money on one life.
Through surveys and economic research, we can estimate how much Australians collectively value avoiding a crash, which gives us a broad measure taking into account all of the individual costs from legal costs to medical related costs.
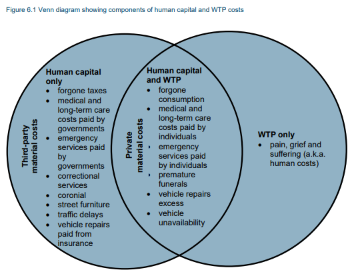
I looked at two cost-based approaches which vary in their approach to calculating the cost of an accident:
- Hybrid Human Capital (HHC) using the Bureau of Infrastructure and Transport Research Economics (BITRE) 2022 report titled ‘Social Cost of Road Crashes’, which calculates the social cost of a fatality at $2.9 million, hospitalized injury at $241k, and non-hospitalized injury at $26k. (Page 4, $2022)
- Willingness To Pay (WTP) using the Australian Transport Assessment and Planning (ATAP) 2024 report titled ‘Willingness-to-pay…Research report’, which calculates the cost of a fatality at $6.7 million, hospitalized injury at $650k, and non-hospitalized injury at $54k. (Table 6.13, $2024)
A WTP estimate was chosen as the favoured method as it is internationally recognized to provides a stronger and more accurate economic estimate by including the massive intangible cost of pain and suffering.
So which intersection has cost us the most?
I will use methodology developed from the approach Wang Yin Ng (2022) used to look at Adelaide. While Ng uses a 3-year time span and a selected amount of intersections, this post uses a 10-year timespan to increase the amount of crash data, as has ranked every signalized intersection with sufficient data in a larger study area.
The below intersections have recorded the highest total social cost using the WTP estimate. Of note, each one has at least one fatality, and #2 and #3 have extremely high traffic volume.
| Intersection | Volume (Percentile) | Fatalities (#) | ++Total Social Cost ($)++ |
|---|---|---|---|
| #1 FLEMINGTON / GATEHOUSE / HARKER | 76th | 3 | 34 229 996 |
| #2 PHE / SPRINGVALE | 97th | 1 | 27 975 854 |
| #3 STH GIPPSLAND HWY / CAMMS RD | 98th | 2 | 27 532 105 |
Intersections with higher traffic volume are generally associated with an increased frequency of crashes (R²=0.23). Therefore, the approach was taken to normalize each intersection’s metric by the number of entering vehicles using the Victorian SCATS dataset which contains traffic volumes at all signalized intersections. The crashes labelled as intersections within 50m of a SCATS site were aggregated which allows for any metric to be normalized per million entering vehicles.
Without filtering out the quietest intersections, the top 3 only contains intersections in the first percentile of volume. Therefore, I removed the quietest 10% of intersections and ranked them by Cost per MEV:
| Intersection | Volume (Percentile) | Total Social Cost ($) | ++Cost per MEV ($)++ |
|---|---|---|---|
| EXHIBITION / LITTLE LONSDALE | 13th | 12 270 696 | 231 677 |
| ARDEN / LAURENS | 76th | 34 229 996 | 207 189 |
| Ballarto Road / Potts Road Skye | 63rd | 24 317 965 | 183 024 |
#2 and #3 have experienced both high volumes and a high social cost from lots of crashes recorded. However, #1 is relatively quiet in terms of volume, while the total cost exceeds twelve million dollars where the majority is derived from one fatality. This poses the question: are intersection like this truly dangerous or rather just unlucky?
What if an intersection just had a bad run of luck?
There’s value in estimating the accident frequency expected at similar intersections and comparing it to how many crashes were actually recorded. I adapted Ezra Hauer’s 2002 tutorial for Melbourne.
To do this, I fitted a negative binomial regression to the data to model a Safety Performance Function (SPF). The dependent variables chosen were logarithmic MEV and geometry as they were both statistically significant.
SPF Equation: log(E[crashes]) = −0.2040 + 0.4240 × log(MEV) + 0.2849 × geometry
I then wanted to weight the recorded data and the expected accident frequency using the SPF equation, which the Empirical Bayes (EB) method allows me to do. Each severity was calculated individually too such that each site’s EB estimate can be corrected to calculate a more accurate value. This method reduces ‘regression-from-the-mean’ bias which is derived from society often being too interested in the safety of select intersections because they seem to have too many accidents. The EB method also increases precision as it removes a lot of the reason for not using older data.
weight=1/(1+mu*Y/phi)
I was then able to calculate the difference between the SPF and EB estimates to find a value called Potential for Safety Improvement (PSI); which describes how many accidents above expected were recorded. These intersections have the highest PSI value, with each recording more than two times as many crashes as expected from similar intersections.
| Intersection | Volume (Percentile) | Crashes (#) | ++PSI++ |
|---|---|---|---|
| #1 CLYDE / GREAVES / O’SHEA | 96th | 56 | 33.48 |
| #2 CEMETERY / LYGON / PRINCES | 94th | 56 | 33.47 |
| #3 SYDNEY / MAHONEYS / CAMP | 99th | 56 | 33.39 |
On the other end, these sites recorded less accidents than expected. These intersections should be studied too to verify the success of any installed safety features.
| Intersection | Volume (Percentile) | Crashes (#) | ++PSI++ |
|---|---|---|---|
| KOROROIT / FERGUSON | 99th | 0 | -10.55 |
| WARRIGAL / LINKS ESTATE ACCESS | 99th | 0 | -10.42 |
| Mornington Peninsula Freeway / Dingley Bypass | 98th | 0 | -9.37 |
However PSI values are quantified as a number of accidents, which we previously found don’t account for crash severity. Additionally, both rankings are dominated by high volume intersections because high traffic amplifies PSI values. So let’s convert them to WTP cost and normalize for traffic volume.
Which intersections do we need to fix?
We can now find the intersections with a higher social cost than expected. The following have teh highest PSI WTP costs and should be flagged for potential investment in safety:
| Intersection | Volume (Percentile) | PSI | ++PSI WTP ($)++ |
|---|---|---|---|
| PHE / WARRIGAL | 98th | 32.65 | 1 086 659 |
| CLYDE / GREAVES / O’SHEA | 96th | 33.48 | 1 082 416 |
| SYDNEY RD / SOMERTON / COOPER | 96th | 29.74 | 1 061 189 |
Again, to see if these intersections are a symptom of high traffic volume, the ranking can be normalized per million entering vehicles. As the ranking is once again dominated by sites in the first percentile of volume, the quietest 10% of intersections were filtered out.
| Intersection | Volume (Percentile) | PSI WTP ($) | ++PSI WTP MEV ($)++ |
|---|---|---|---|
| #1 FRANK-DANDY / KIRKHAM | 12th | 3 023 120 | 59 798 |
| #2 ST KILDA / HIGH / LORNE | 42nd | 5 111 011 | 52 709 |
| #3 PHE / GLADSTONE / JONES | 65th | 7 293 143 | 52 617 |
As each signalized intersection in Melbourne was included in the analysis, it is possible to map all 2000+ intersections.
[Map]
But will changes be cost-effective?
Taking the ____ intersection in SIDRA guided by the SCATS diagram, we can model changes to the intersection.
Conclusion
Cyclists and pedestrians will always be over-represented in crash statistics as they are the most vulnerable road users. However they continue to be under-represented in funding. Australia records 39 fatalities and over $2 billion in social costs for cyclists alone each year. Yet just 90 cents per person are spent on walking and cycling infrastructure.