Melbourne spends less per person on its urban bus network than any other major Australian city. This leaves the network infrequent on weekends when people travel most, and routes which do provide high frequencies are limited in their coverage. In 2023, a quiet yet ambitious plan to revolutionize the bus network was created and promptly voted against by cabinet. As I revisit this proposal, I set out to evaluate if it was feasible and how effective it would have been.
Redesigning Melbourne’s Bus Network
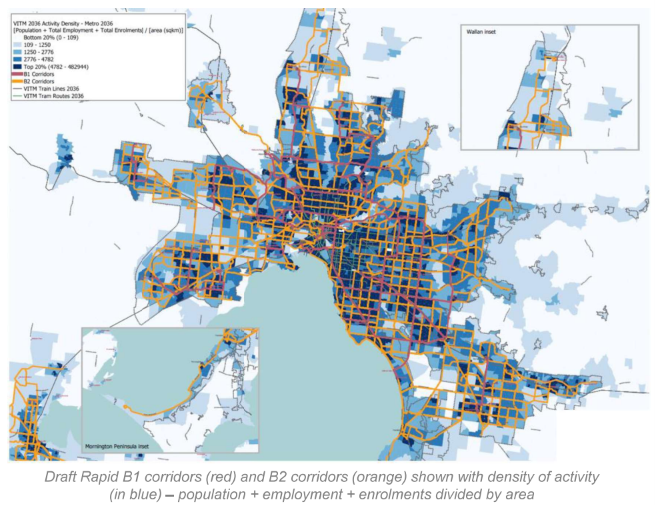
This map above is a high-level spatial plan created by the Department of Transport and Planning (DTP) in 2023 which was accessed through an FOI request. It includes two frequency tiers where B1 corridors are likely to be used by routes twice as frequent as B2 corridors.
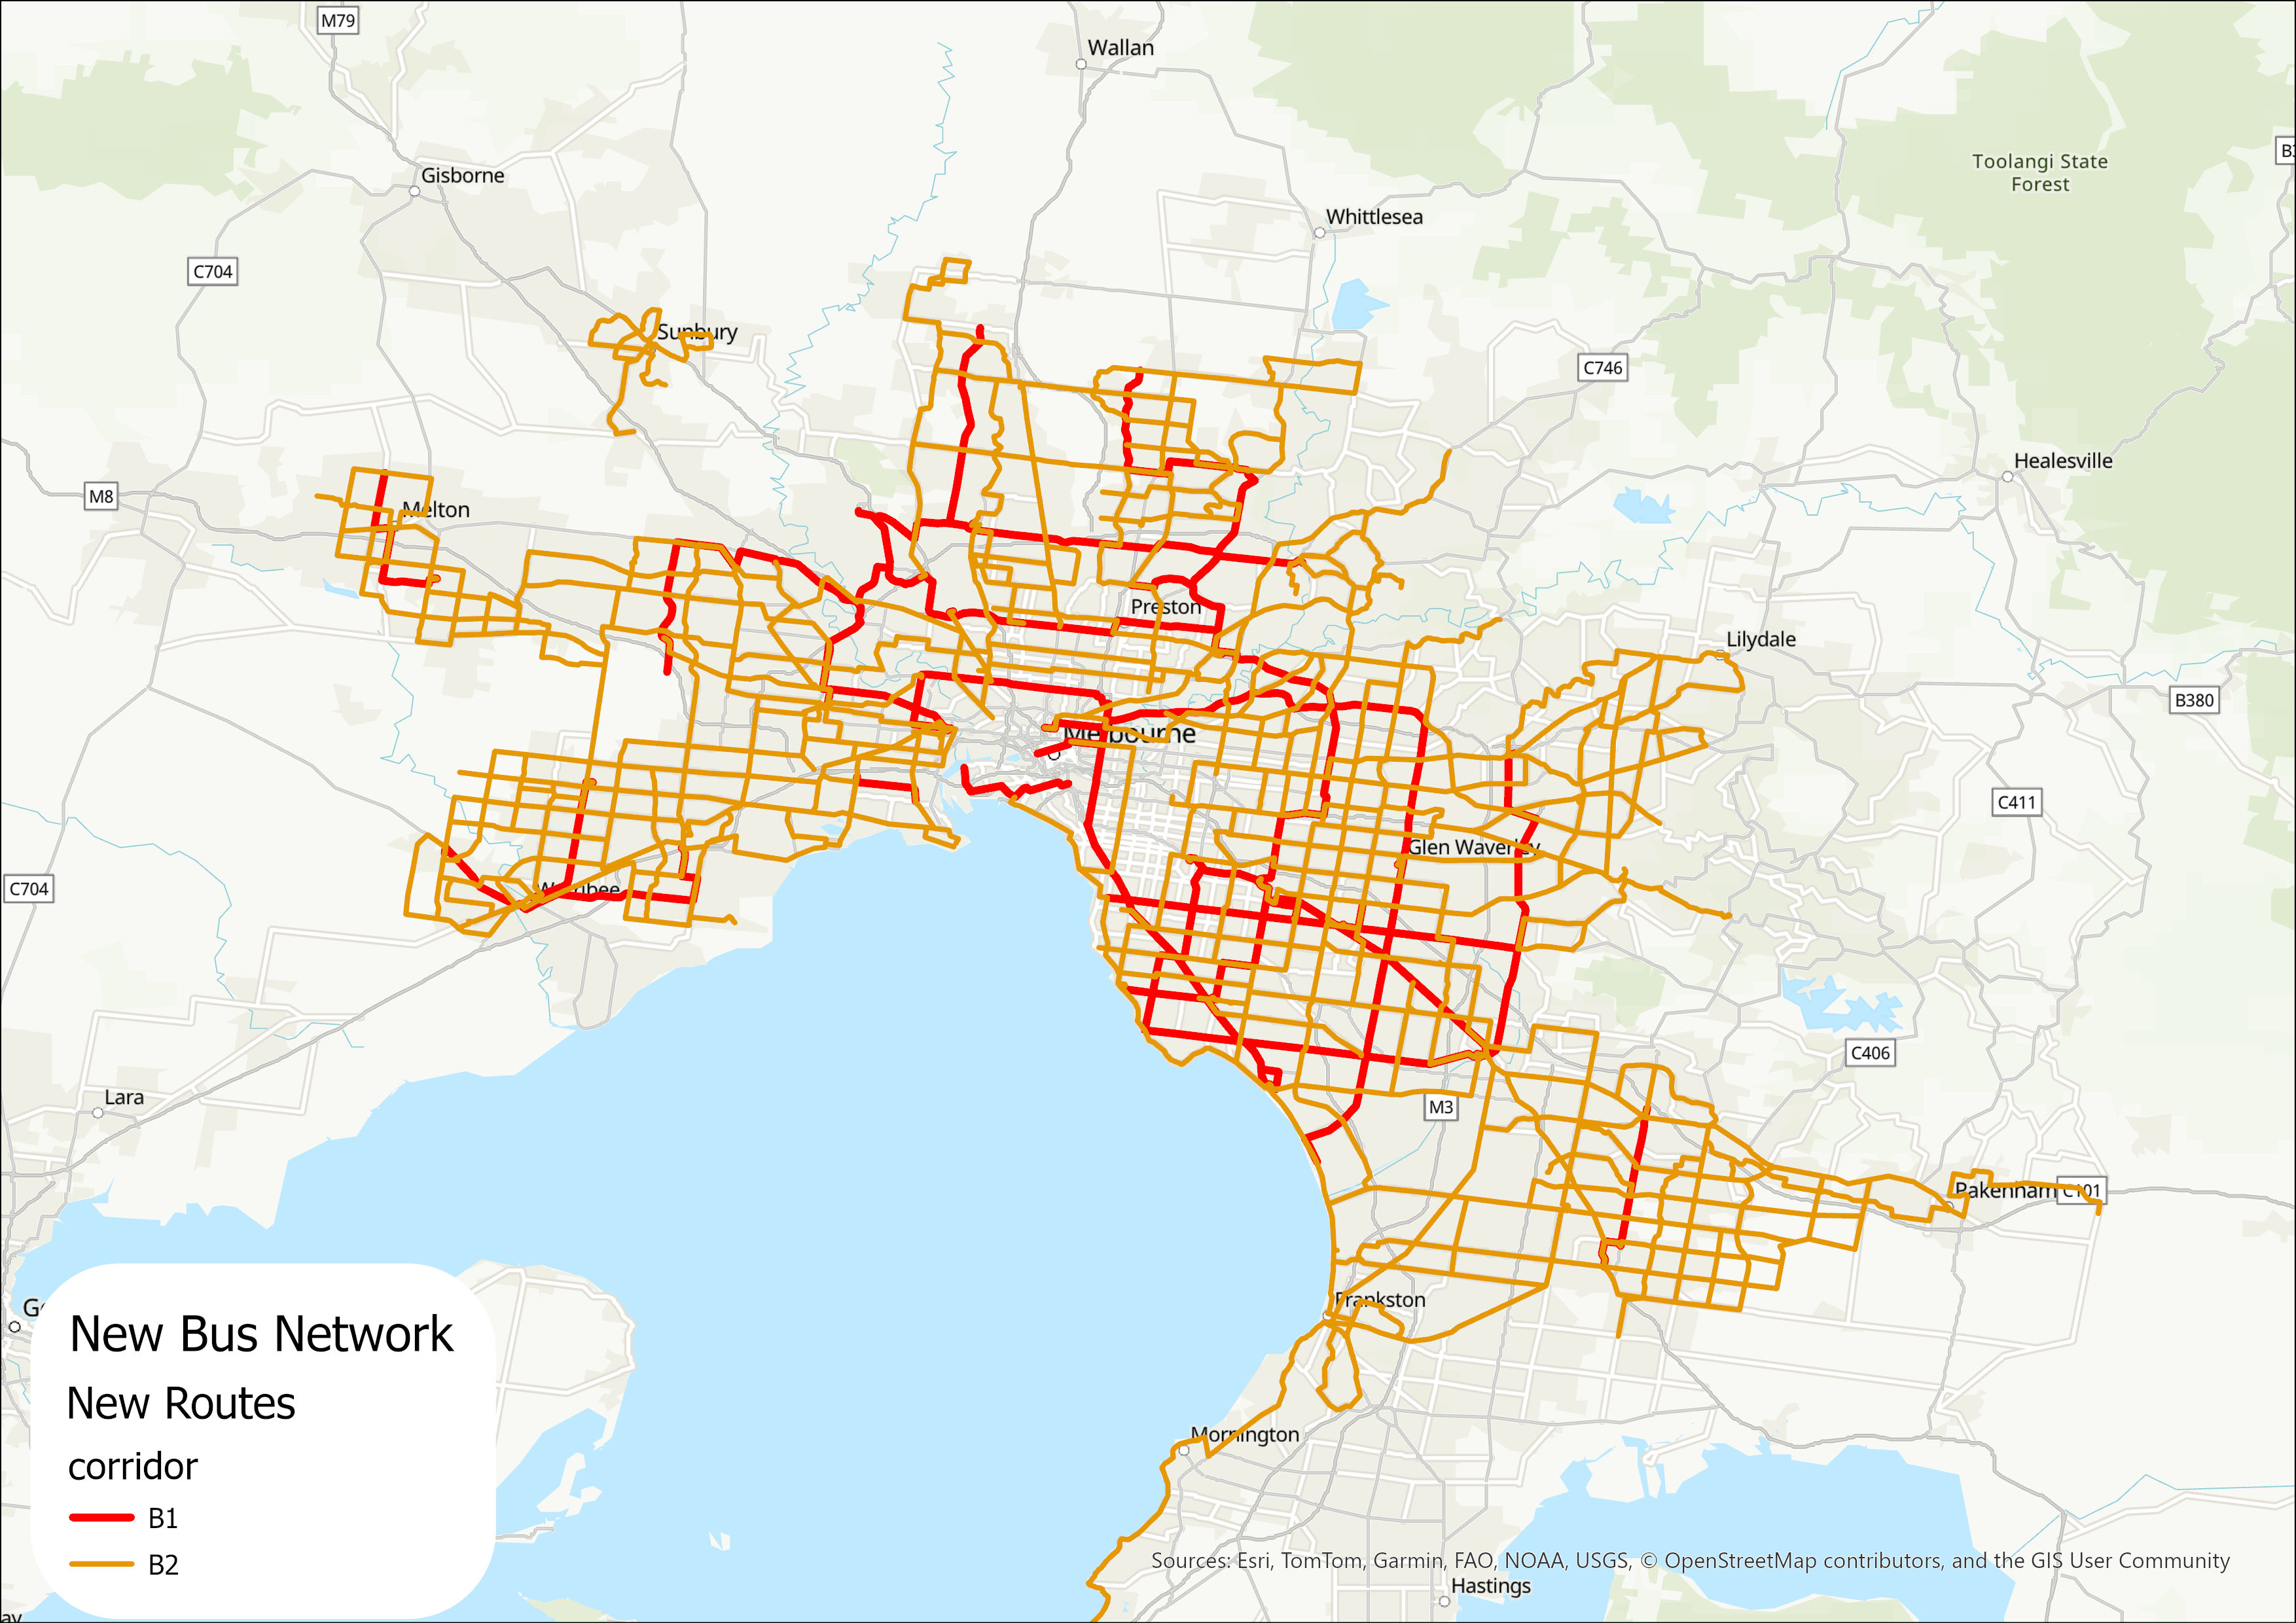
DTP’s map guided me in modelling a brand new bus network however my own interpretation of the map was needed to create each route. What I believe makes a good route is maximizing coverage, creating easy interchanges, ending routes at popular destinations, and standardizing route length. My new network reduces the total route distance served to 5231 km, with 941km of that having higher frequencies shown by red lines on the map. You can check each of the routes out through an interactive map.
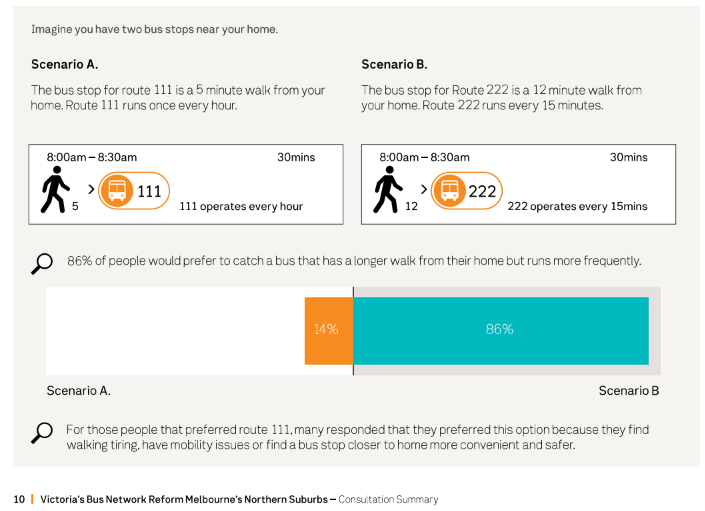
Shifting the standards from a bus within 400m to 800m of all residents is a huge change that will leave many temporarily fearing isolation. It will naturally be difficult for many communities to adapt to a radically changed network where their established local route doesn’t necessarily deserve a route today. Nevertheless, whilst there may be a tricky interim period, communities will find themselves more connected than ever because a grid-based network fundamentally connects destinations more efficiently and effectively.
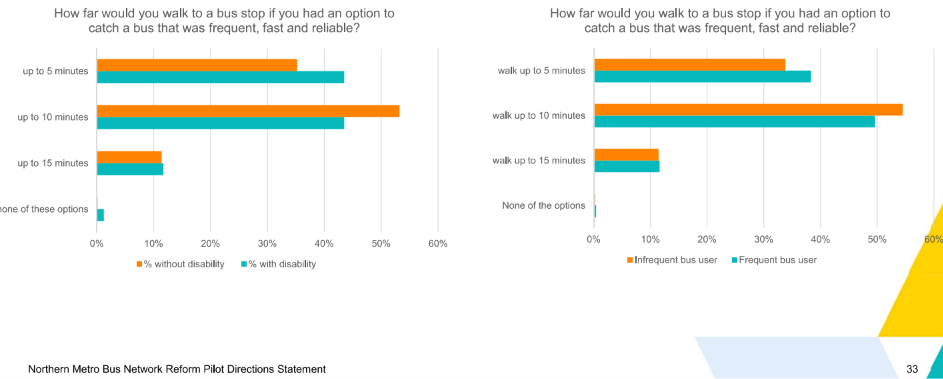
Of course, a ten-minute walk is reasonable for most people, but accessibility requirements should remain paramount. People do plan their lives around the available transport options, and it’s important to understand their needs before any state department can begin to decide what is best.
It’s impossible to meet the needs of all individual trips when making any substantial changes. Nonetheless, in the same journey time (whilst possibly requiring walking further), bus reform has the potential to connect substantially more people to more opportunities than ever before. You can have a look at how this proposed network will affect you at mohanwadia.com/srl.
Who can access this new network?
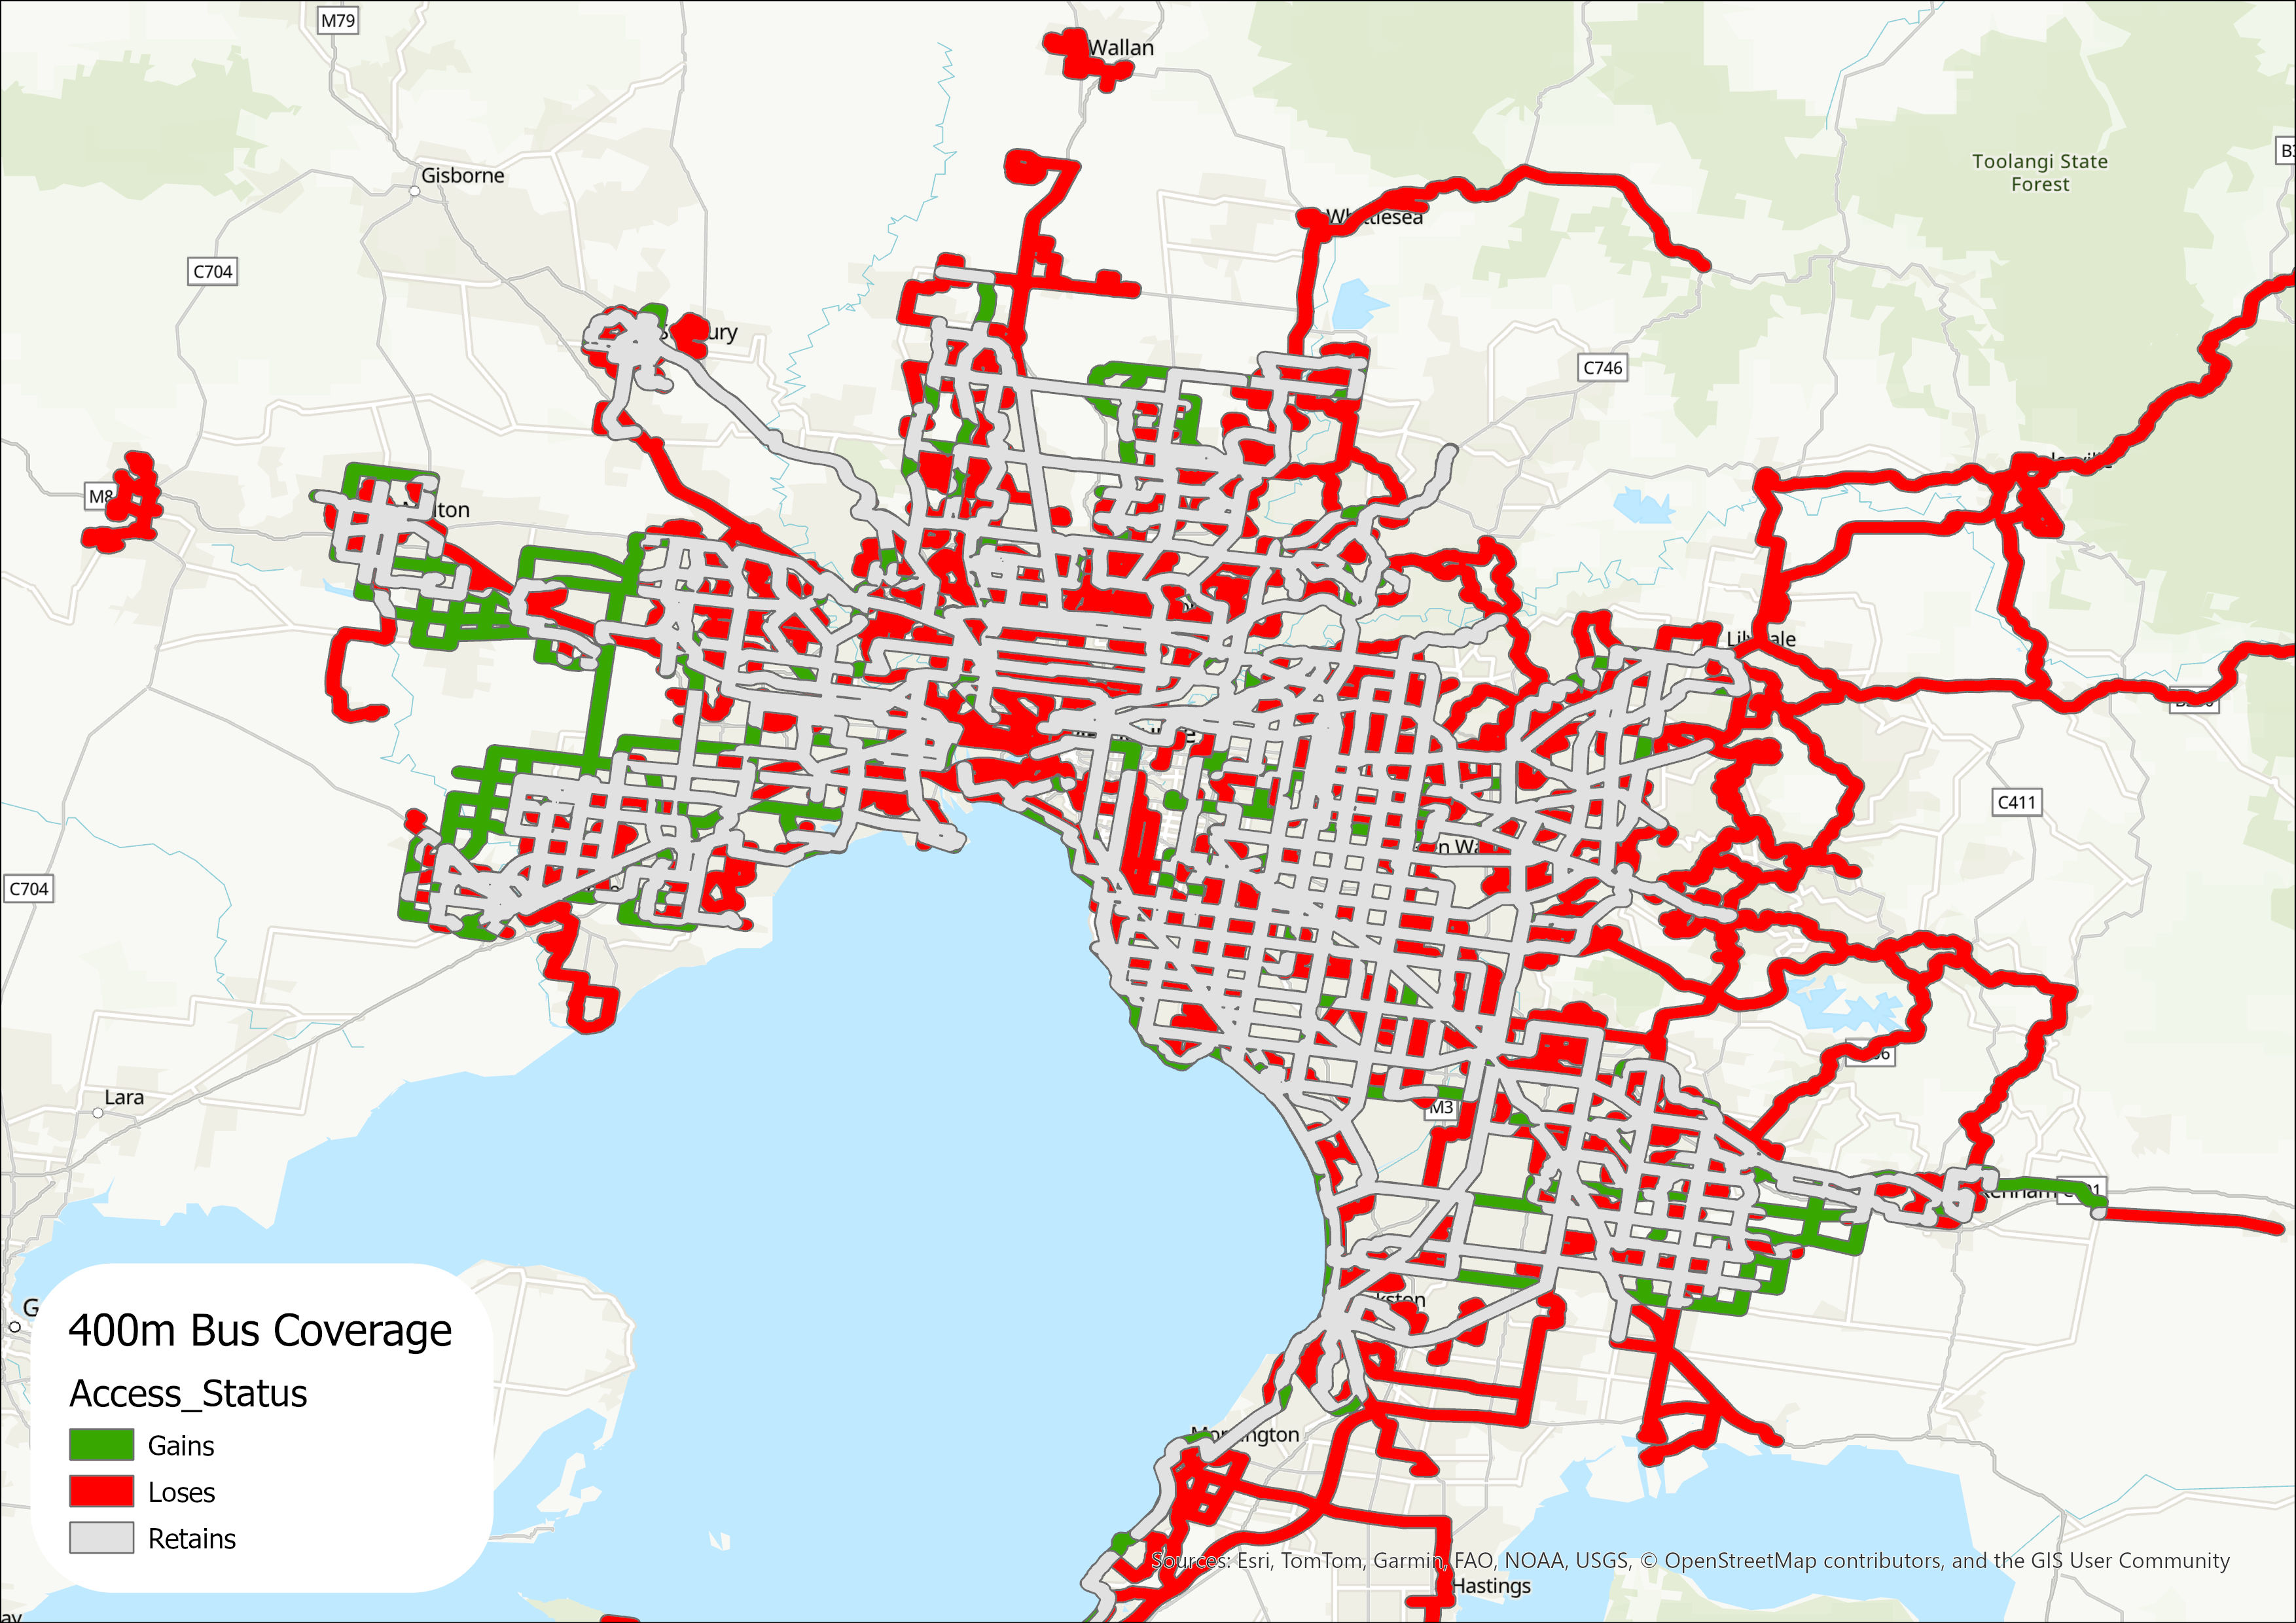
The map below, produced in ArcGIS Pro, shows the coverage areas which used to have a bus route within 400m but do not have a bus route within 800m anymore. At the new standard of coverage is 800m, the one Victoria’s Bus Plan is premised on, very few people lose coverage. Against the stricter 400m benchmark, a lot of people will lose access to their local route, yet most Melburnians are open to walking further if it means they are paradoxically better served.
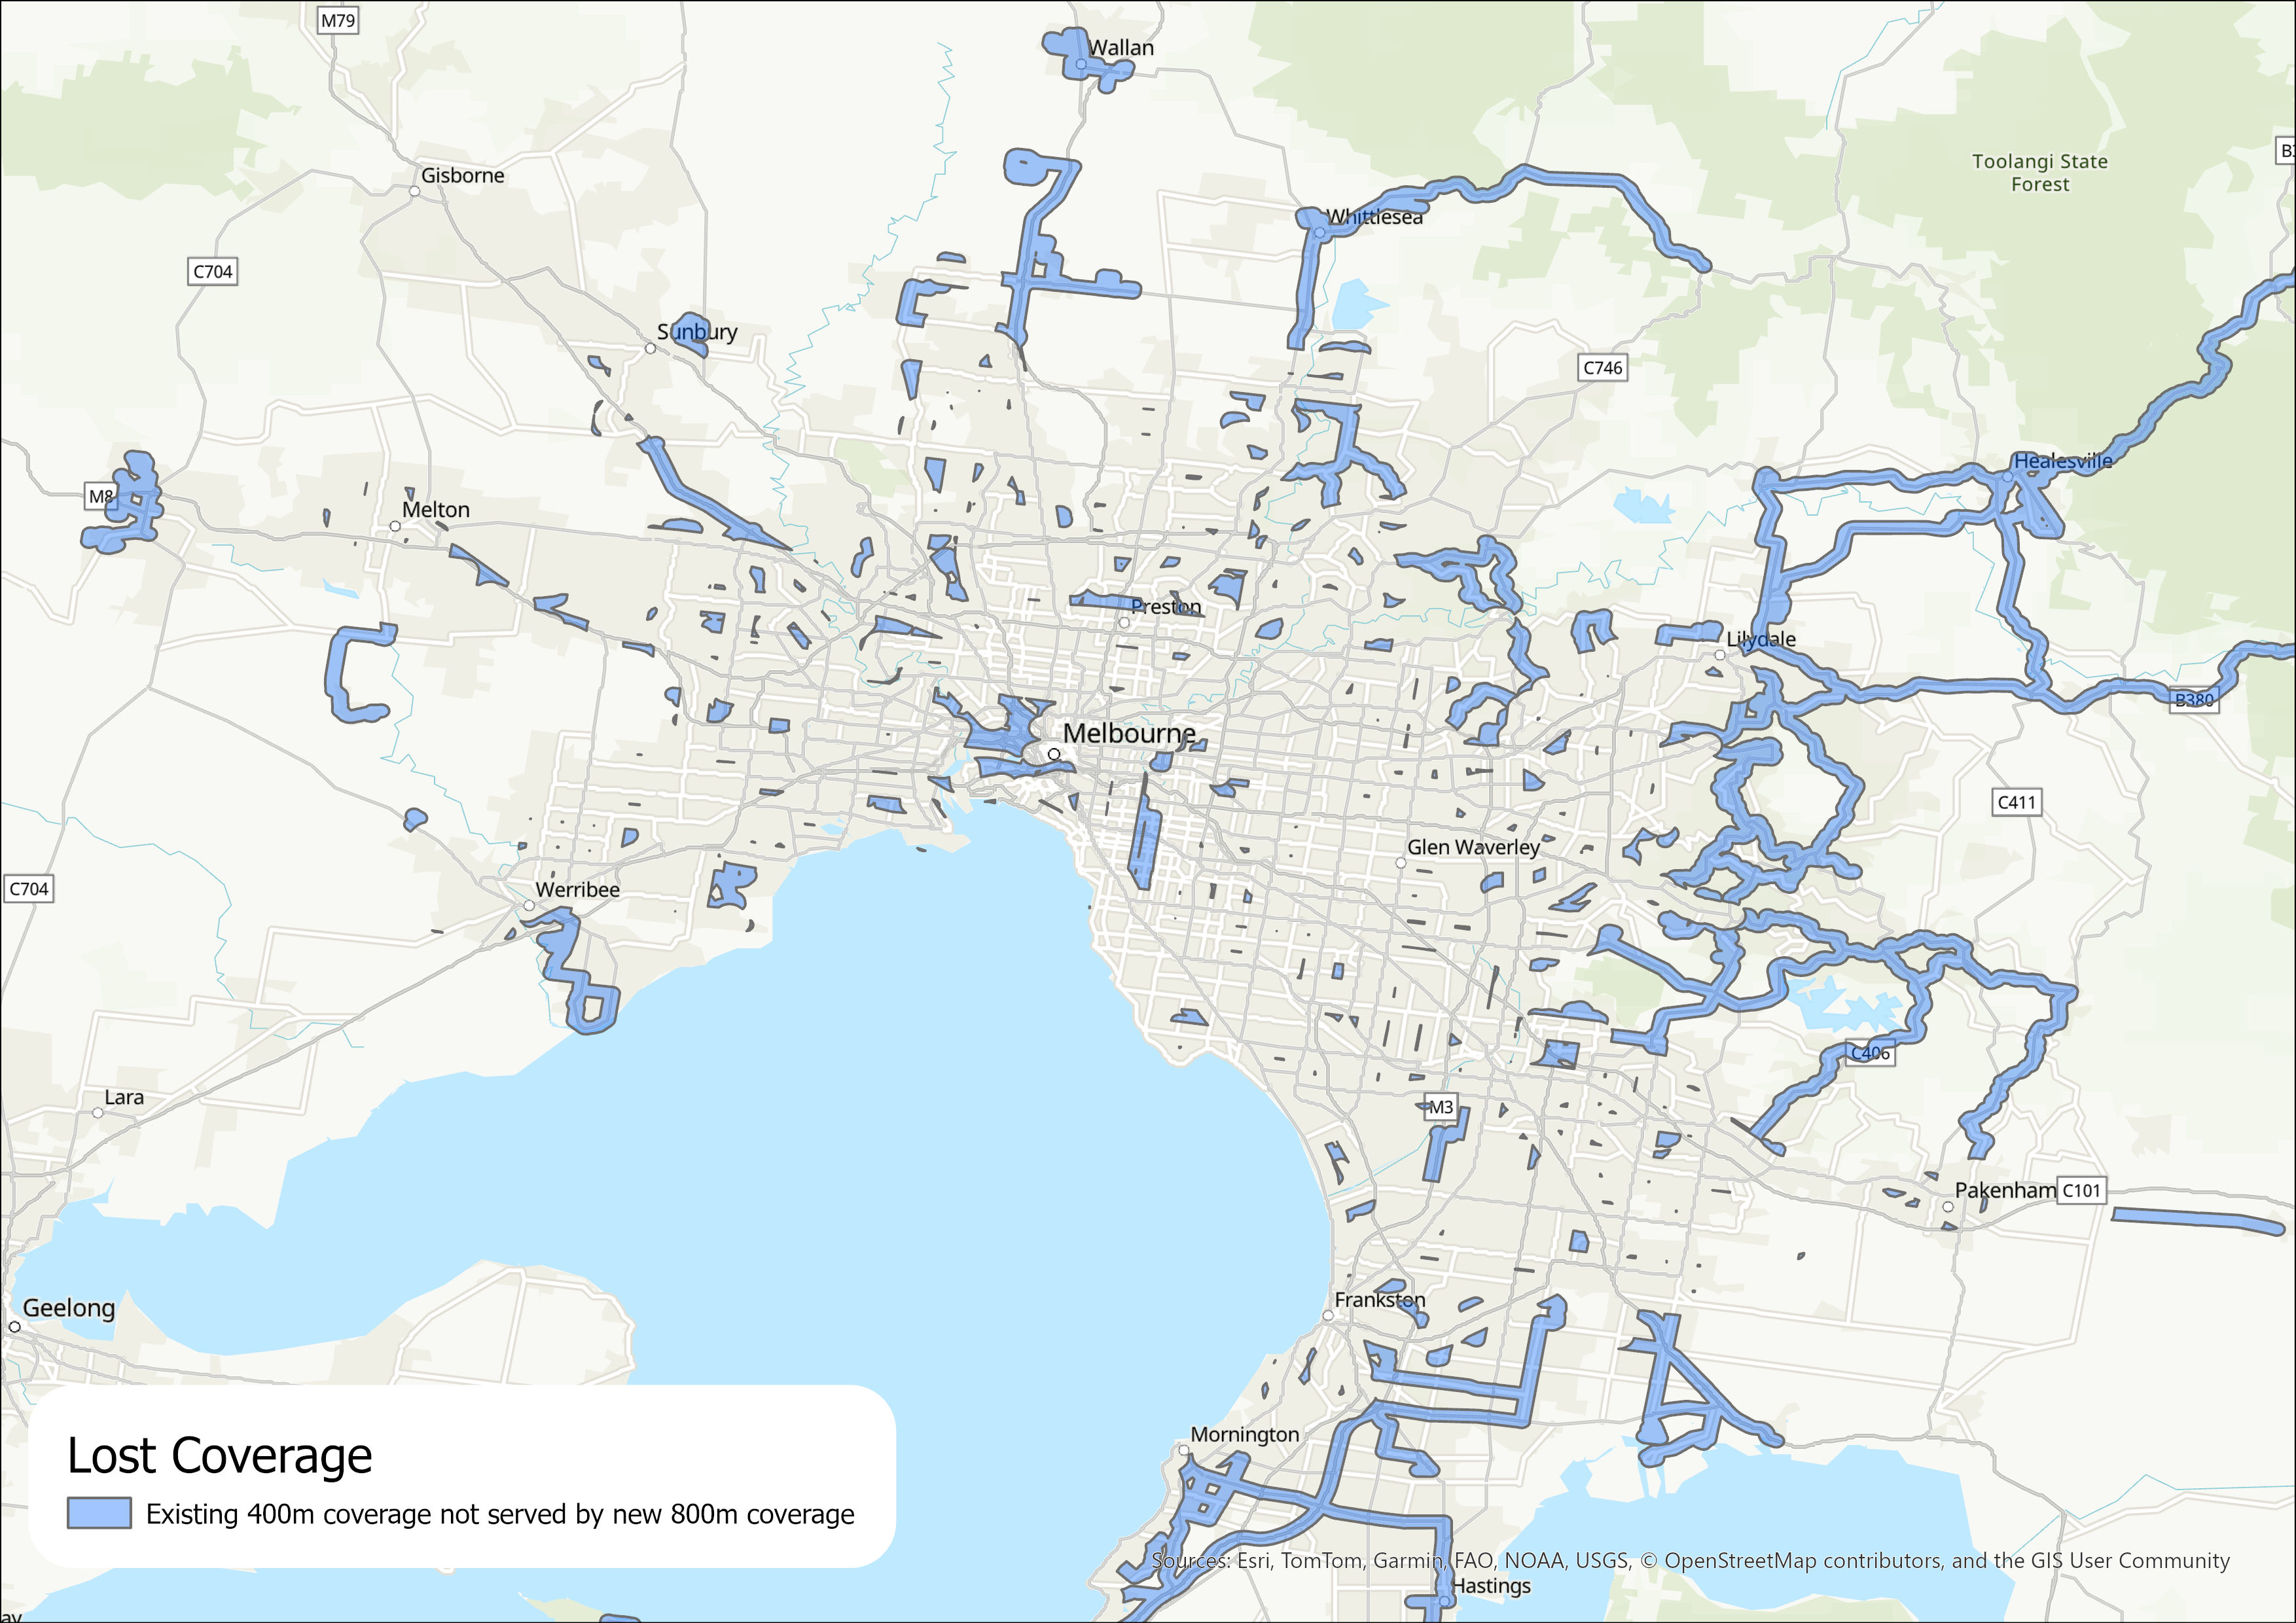
Smaller areas of coverage loss indicate the grid network has caused the closest high-quality bus route to be slightly further away than 800m, while larger areas typically correspond to removed infrequent routes which could be retained in a new network for an additional cost. Out of scope for this post were B3 and B4 routes, though their inclusion at additional costs warrants evaluation.
However, bus reform will never work if we require a large portion of our population to be within 400 metres of a bus stop. The map below shows the change in coverage with 400 metre requirements upon implementation of a reformed network. Within the grid, red areas begin to emerge from deprioritized local routes. Low-patronage connecting routes in the outer east do not form part of the prioritized corridors, however I believe these should be retained as lower-frequency routes.
The following analysis uses Infrastructure Victoria’s weak definition of a high-quality bus as one which operates every 20 minutes or better, 6am-8pm, and runs on weekends. The reformed network records a substantial 16 and 23 percentage-point improvement in high-quality service coverage within 400m and 800m respectively. On top of that, all new routes are likely more frequent, with close to turn-up-and-go frequencies 7 days a week, removing the need to check a timetable.
routes = gpd.read_file("gis.geojson").to_crs("EPSG:7855")
sa1 = gpd.read_file("G01_VIC_GDA2020.gpkg", layer="G01_SA1_2021_VIC").to_crs("EPSG:7855")
check_scope = pd.read_csv('SA1.csv')
sa1["sa1_area_m2"] = sa1.geometry.area
buf = gpd.GeoDataFrame(geometry=[unary_union(routes.buffer(400))], crs=routes.crs)
c = gpd.overlay(sa1, buf, how="intersection")
c["pop_allocated"] = c["Tot_P_P"] * (c.geometry.area / c["sa1_area_m2"])
print(c["pop_allocated"].sum())| Existing Network | Reformed Network | |
|---|---|---|
| Any bus within 400m | 3,024,287 (83.0%) | 2,106,401 (57.8%) |
| High-quality bus within 400m | 1,527,328 (41.9%) | 2,106,401 (57.8%) |
| Any bus within 800m | 3,462,648 (95.0%) | 3,083,187 (84.5%) |
| High-quality bus within 800m | 2,237,266 (61.4%) | 3,083,187 (84.5%) |
While there are 25-percentage-point reductions in local coverage to achieve the following, it should be noted that in this new case more people than ever before will be able to access a high-quality bus route within 800 metres than those that previously could access any bus route within 400 metres.
An important caveat is the new network of B1 and B2 routes fails to provide coverage within 800m for just under 400 000 people in Melbourne that used to have a service. This is partly due to less CBD bus coverage and B3 and B4 routes which fall out of scope of my reformed network, but mostly due to the removal of local routes which increased local coverage at lower frequencies.
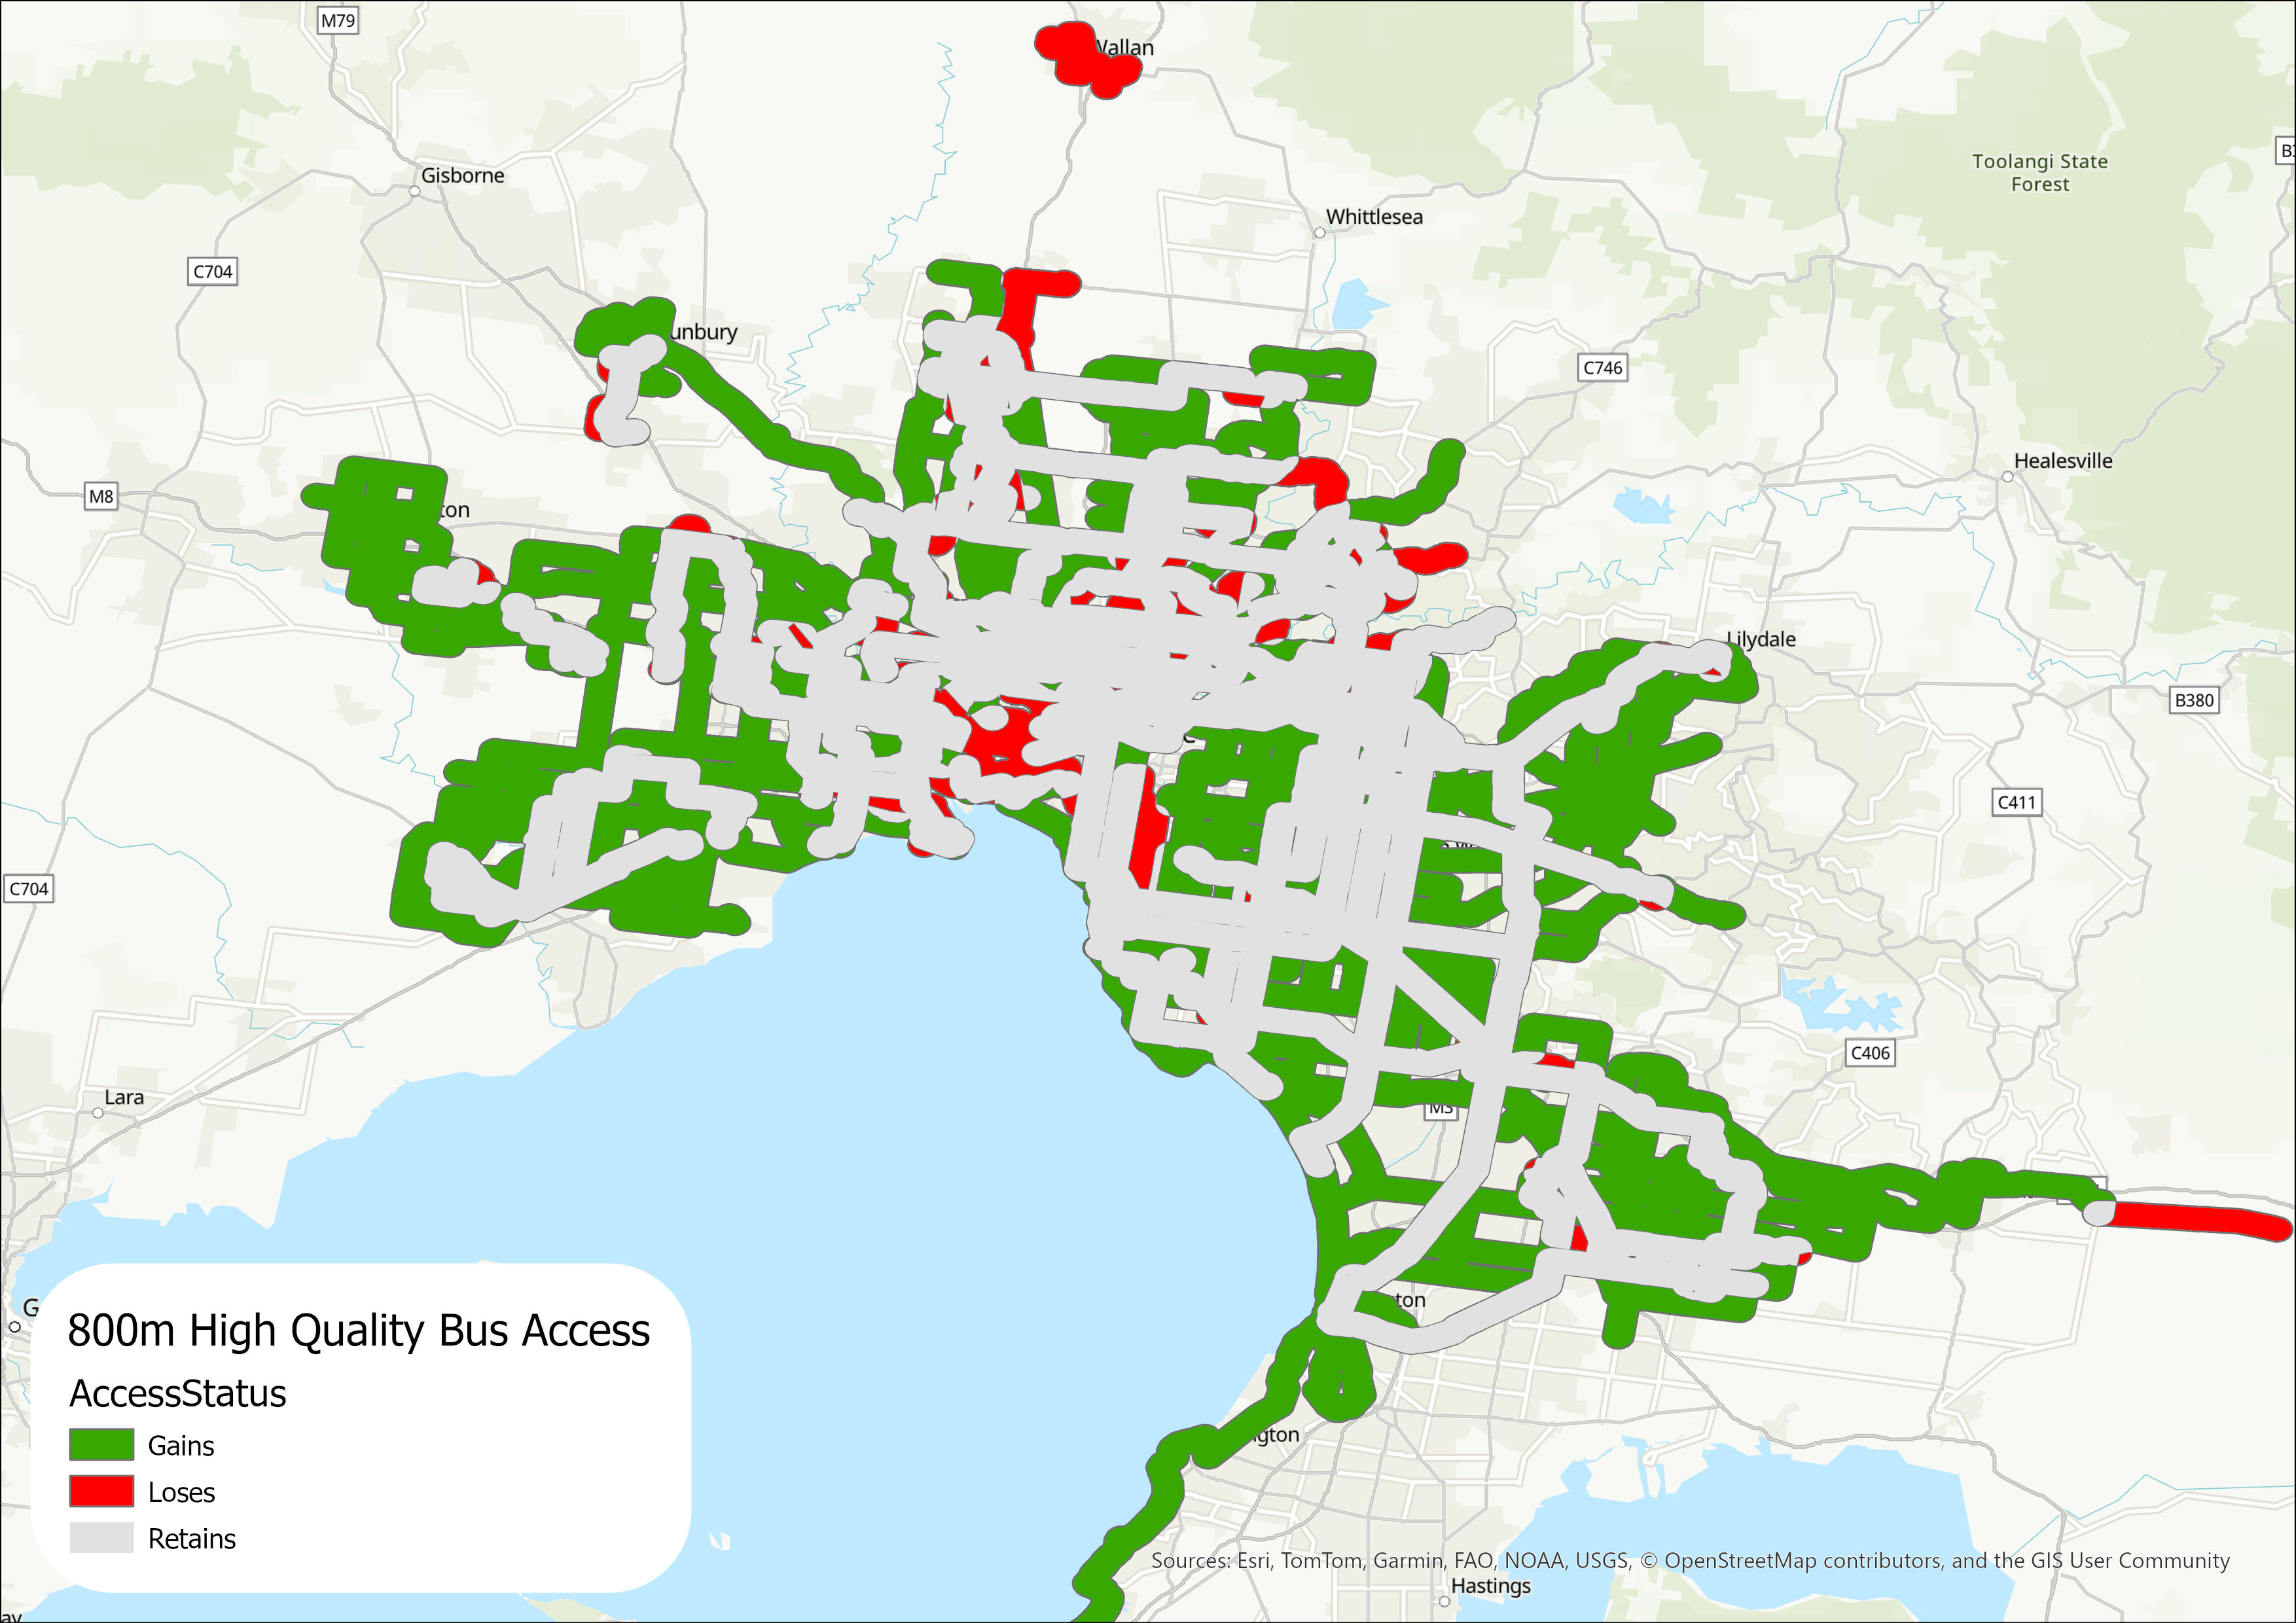
Viewing the improvements in 800m coverage of high-quality routes, these frequent routes mean that most areas of Melbourne are provided with many new services. Additionally many of our current frequent routes, including part of SmartBus routes, fall under B1 corridors and hence could receive huge improvements too. Crucially, people won’t walk further if these new routes don’t deliver turn-up-and-go frequencies.
When do people actually travel?
Service supply needs to meet trip demand in order to efficiently allocate resources. So when does trip demand actually taper off, and is it unmet at typical non-commuting hours? Using gtfs-kit, we can find the following GTFS bus network statistics:
import gtfs_kit as gk
feed = gk.read_feed("Desktop/google_transit.zip", dist_units="m")
trip_stats = feed.compute_trip_stats()
dates = ['20260829', '20260830', '20260831']
gk.miscellany.compute_network_stats(feed, dates, trip_stats)| Monday | Saturday | Sunday | |
|---|---|---|---|
| Number of Trips | 27398 | 16869 | 12668 |
| Number of Routes | 658 | 571 | 480 |
| Peak Time | 5:06pm | 12:30pm | 11:31am |
| Vehicle Kms | 421457 | 264720 | 202101 |
| Speed | 23.8 | 25.3 | 25.8 |
We see that the service distance dramatically decreases on Saturdays (-37.2%) and Sundays (-52.0%). In theory this means that frequencies are around half however in practice this greatly varies per route. When we compare this to the number of trips taken by passengers, the Victorian Integrated Survey of Travel & Activity (VISTA) reports a 74% patronage decline on buses on weekends, while Patronage Data records a 56% decline on the same measure.
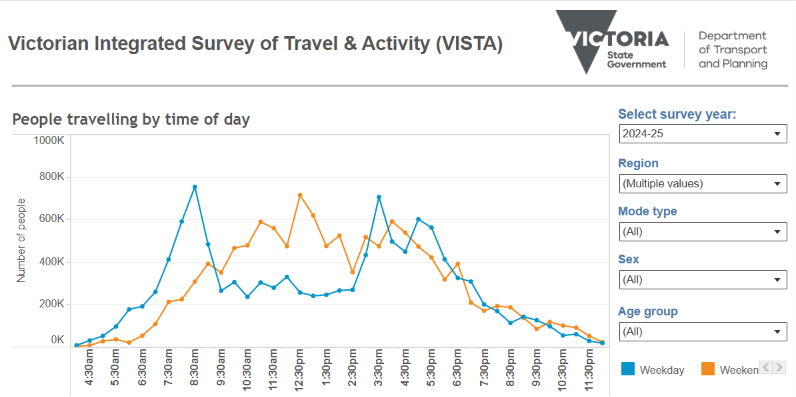
It’s a myth that travel demand reduces on weekends; rather it translates from leading in work related trips (20.2%) to significantly recreational (38.3%). In-fact more trips taken on the average weekend (17 million) than weekday (16 million). Comparing existing public transport supply to total trip demand using a percentage-based graph to view data on a time basis, we get the following:
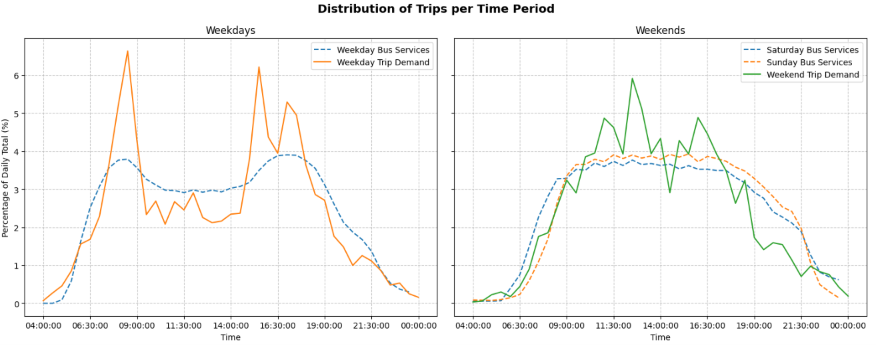
Trip demand on weekdays during the commuting and school pickup times record extreme peaks that bus services attempt to but fail to meet. Peak services are more expensive to provide than a consistent timetable however are often scheduled out of necessity while uneven frequencies can create a paradox where it’s not viable to travel on PT at other times. On weekends, trip demand exceeds service supply during the day while services exceed demand in the late afternoon and early evening.
So how do we create a transport network that supports all types of trips and complements other transportation methods? Run bus services at all times of the week in order to create a network that can be trusted and generate future demand. Service investment is often less obvious to the public than infrastructure spending, hence to immediately increase patroange on reformed routes, it’s important to communicate changes effectively.
Will a new network be frequent enough?
Which frequency would these routes be able to achieve by utilizing current resources? It’s up to the priorities of the state government to reallocate resources. Assuming B1 routes are to be twice as frequent as B2 routes as provided by Victoria’s Bus Plan, there are a few ways to divide up resources:
- Equal resources across days and hours
- Equal resources across hours with reduced weekend frequencies on all routes
- Providing peak services on weekdays at the cost of reduced span and/or off-peak frequencies.
Let’s first assume the simplest frequency pattern of constant service between 6am and 12am on all routes 7 days. Calculating the frequencies using the current distance budget of 2284411.27 km per week from Adam Bain’s FrequencyFinder, and the total distance of the reformed network routes of 5231km with 941km at twice the frequency, a new network will achieve B1 routes operating every 10 minutes, and B2 routes operating every 20 minutes. Alternatively, if all routes run at the same frequency, there would be a consistent 17 minutes between services, however many high-priority corridors would lose the frequent service they currently have.
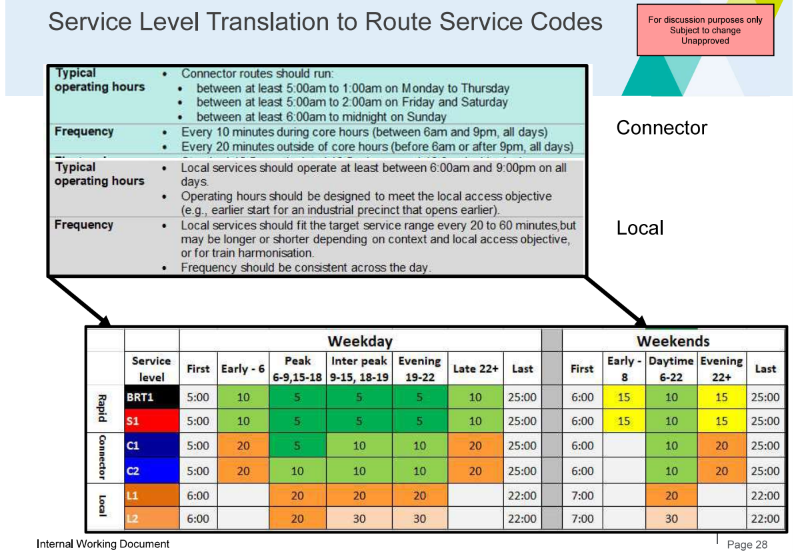
These frequencies still provide turn-up-and-go services on B1 routes and will improve bus services in most areas. Unfortunately, these frequencies record as half of what Victoria’s Bus Plan promises, where an S1 service (serving B1 corridors) is specified with 5 minute frequencies for most of the day. Therefore, significantly greater investment is required in order to reduce the time between services to 5 minutes on B1 routes and 10 minutes on B2 routes. This calculation demonstrates our current network is both underfunded and inefficient.
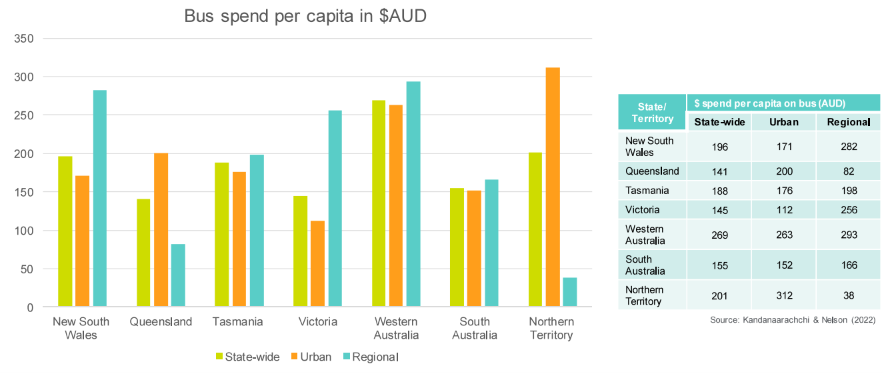
Part of the issue is that Victoria historically spends less per capita on running bus services than any other state at $112 per capita. While our tram network is excellent, a great proportion of the state budget provides tram services ($606.3M) serving 900,000 people within 800m while bus services ($1008.2M) serve a much larger 82% of Melbourne at a fraction of the per-capita cost. While trams serve their corridors well; with high fixed costs that preclude reallocation; it’s important to note that buses continue to get neglected as the default public transport medium in most areas of Melbourne.
It is worth noting that a successful Bus Plan should be paired with other measures such as bus priority, and also will receive improvements in network efficiency when removing peak periods and local routes. Some measures are more complex to implement such as dedicated busways, while others are easier including stop relocation, bus movements, and performance targets.
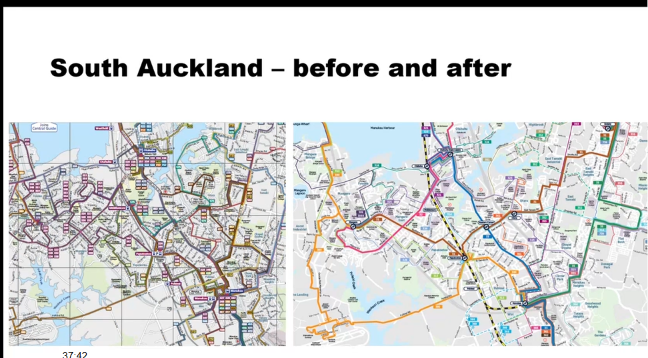
For example, Auckland was able to achieve substantial efficiency gains in km served when implementing it’s hugely successful recent bus network improvements. They also chose to invest substantially to deliver a highly successful outcome within a political environment with sustained advocacy. Direct and frequent routes are easier to run for bus companies and much easier to predict and hence use for passengers without the need for a journey planner or timetable.
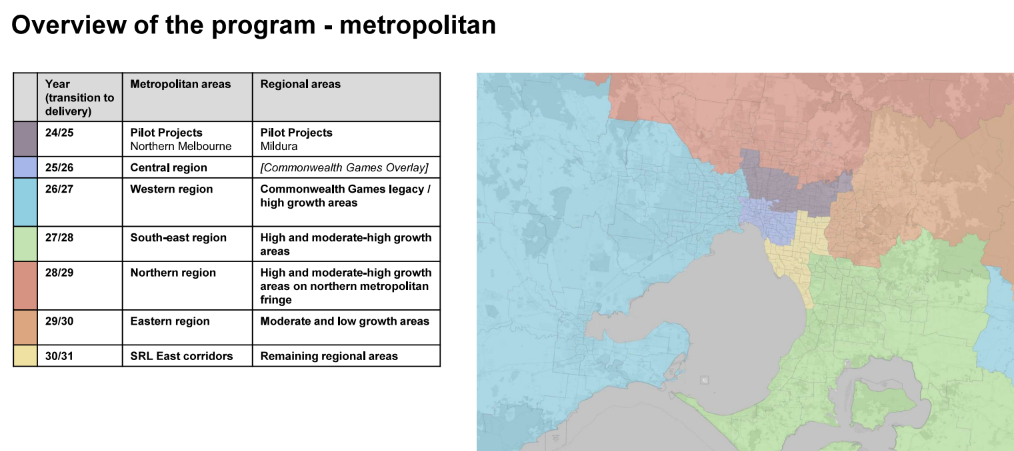
However, for this to happen in Melbourne, the department and state government need to fund and provide new routes at a much greater pace than the progress currently made since the introduction of the Bus Plan in 2021. According to documents tabled in 2023, there are currently 50 tasks that must be completed before a route can be implemented, and the progress of the program is rapidly falling behind schedule.
The Bus Plan sets an ambitious goal for Melbourne’s bus network to become a mass transit option from 2031. It aims to meet user needs by reforming the network so that it is simpler, faster and more reliable. Given the current network, and progress implementing the Bus Plan, on present indications the department will not achieve the Bus Plan’s mass transit ambition. (Improving Bus Services - VAGO)
Can a cost-neutral approach be effective?
Now that we’ve seen what would happen if we distribute resources equally across the week, what if we instead retain the inefficient operations that attempt to respond to peak demand and historical weekend demand? The frequency and span start to look different, with a universal sharp decline around 10pm, and drastically decreased service on weekends.
import gtfs-kit as gk
df = gk.trips.locate_trips(feed, date, times)
counts = df.groupby('time')['trip_id'].nunique().reset_index()
counts['date'] = date
pivot_df = counts.pivot(index='time', columns='date', values='trip_id').fillna(0)
pivot_df.plot(kind='line', marker='o', ax=plt.gca())
plt.show()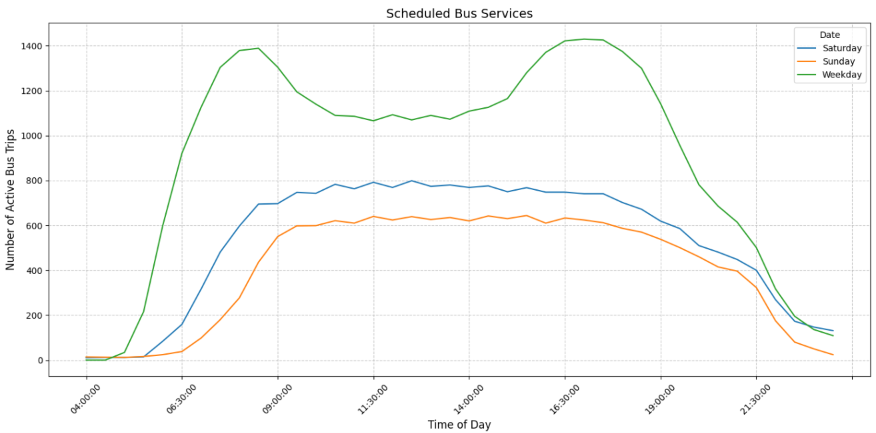
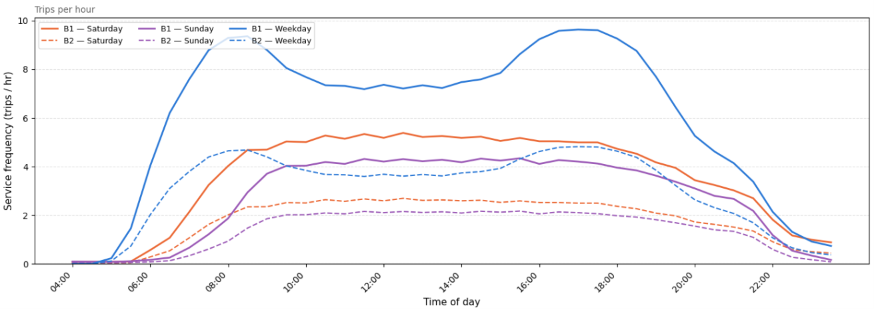
Even more interestingly, what happens when we normalize these charts to the new case using current resources? The B1 routes peak at 9 buses per hour however as peak services are generally more expensive to operate, this comes at the cost of a reduced frequency during the interpeak and crucially doesn’t allow for sustained service in the late evening.
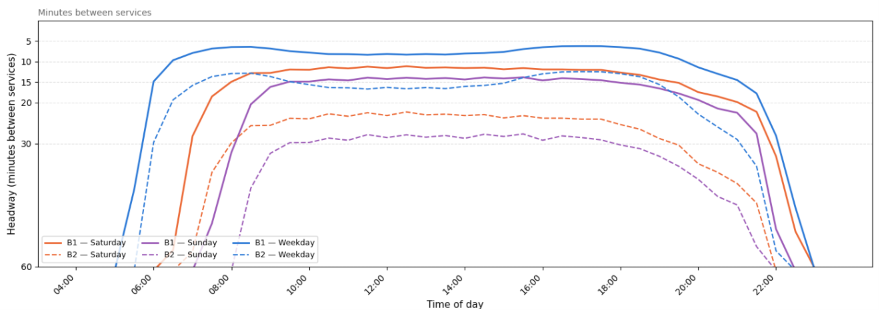
Let’s convert the previous chart to frequency to find the average time between services of reformed B1 and B2 routes per time and day of the week. During 9am-5pm 7 days a week, no route falls below a 30 minute frequency, and B1 operates at tram-like frequencies. Unfortunately, the late starts on weekends can deter patronage, and similarly service ceases between 10pm and 11pm as frequencies gradually taper off.
The Verdict
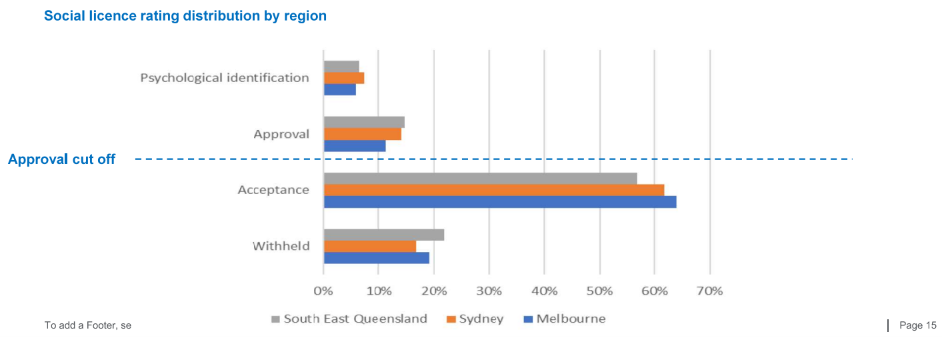
Bus network reform has the potential to substantially increase patronage if done right. However, current investment, which translates to poor frequency and span, won’t allow a cost-neutral bus reform to fix all of the issues that currently limit the network’s effectiveness. As Melbourne’s population continues to grow, poor service levels will cause social approval and ridership to deteriorate compoundingly unless action is taken. The following survey results record Melbourne with the lowest social approval out of the three cities’ bus networks.
A full reallocation of resources can create frequent corridors but won’t deliver the 5- and 10-minute frequencies presented by the Department of Transport and Planning. Moreover, coverage changes will mean that a significant number of people will lose access to established services, and hence efforts need to be made in order to ensure convenience when walking, waiting, and transferring onto higher-quality bus routes.
Ultimately, bus reform is the logical next step for Melbourne’s network, yet there needs to be political accountability and greatly increased future funding before we attempt to drastically alter travel habits for a large portion of Melbourne.